You can follow these blog posts via RSS.
2026
- Elton John of celeriesJun 2, 2026
- The big ladsMay 1, 2026
- The taxonomy is looseApr 13, 2026
- Maker once knownApr 6, 2026
2024
- A swim with a chat botSep 29, 2024
2022
- Hallucinating with art modelsSep 1, 2022
2021
- Doing the workNov 18, 2021
- A HashiConf art collabOct 15, 2021
- I redesigned my siteJun 24, 2021
- From JavaScript to paper: a linocut adventureApr 28, 2021
2020
- Fixing typedoc's generated TOC if your code is using ES6 modulesFeb 21, 2020
- monica.cssFeb 19, 2020
2019
- Metronomes in JavaScriptSep 10, 2019
- The perils of tensor.dataSync()Feb 22, 2019
2018
- I did an inktober and I want to tell you about itNov 15, 2018
- Hello magentaNov 7, 2018
- Hello tensorflowMay 22, 2018
- How browsers position floatsApr 11, 2018
- An intro to Reinforcement Learning (with otters)Feb 26, 2018
- Automatic visual diffing with PuppeteerJan 31, 2018
- 2017: another year in reviewJan 2, 2018
2017
- ::part and ::theme, an ::explainerDec 18, 2017
- Chrome extensions for quick site redesignsSep 20, 2017
- Shadow DOM: fast and encapsulated stylesAug 11, 2017
- PWAs with Polymer: a checklistJul 26, 2017
- An intro to web components with ottersJun 6, 2017
- Polymer 2.x Cheat SheetMay 31, 2017
2016
- 2016: another year in reviewDec 21, 2016
- Polymer 1.x Cheat SheetDec 13, 2016
- Web fonts, boy, I don't knowNov 1, 2016
- I made a 2001-era emoji font! That you can use!Oct 4, 2016
- Emoji: how do you get from U+1F355 to 🍕?Apr 4, 2016
- I fixed a pair of headphones with some soldering, and you can too!Jan 26, 2016
2015
- 2015: a year in reviewDec 22, 2015
- <input> I ♡ you, but you're bringing me downOct 22, 2015
- Styling the Shadow DOM or: a metaphor gone too farSep 29, 2015
- Keypress is bananasJun 2, 2015
- Why Chromium has code ownersMar 24, 2015
- Contributing to Chromium: an illustrated guideFeb 10, 2015
2014
- Cat-DNS: learning about DNS with catsAug 11, 2014
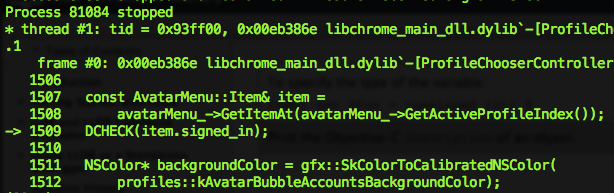
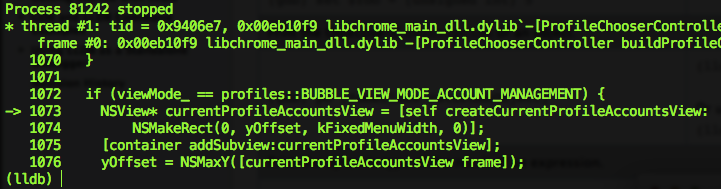
- I don't really want to learn lldb, I just want to fix a crashJun 23, 2014
- Presenter notes that don't suckMay 17, 2014
- Static initializers will murder your familyApr 22, 2014
- Presentation slides and writer's blockApr 9, 2014
- Code reviews for fun and profitMar 31, 2014
- When pull requests get trickyFeb 25, 2014
- Ruby for Canadians: an instruction manualFeb 25, 2014
- Cat-DNS: a DNS server that resolves everything to catsFeb 18, 2014
- Dear sir or madam: the bookmarklet you didn't know you neededFeb 11, 2014
- Oops, I accidentally the whole DNSFeb 6, 2014
- Cocoa gems or: how this isn't about reimplementing Ruby in Objective-CJan 30, 2014
- (Potentially) neat C++ protipzJan 20, 2014